Weekly creative report
template.
A weekly creative report is one row per week: spend, revenue, ROAS, CPA, CTR, hook and hold rate, how many creatives are winning, what launched, the top creative and the next test. Copy it into Google Sheets and fill a row every Monday.
| Week | Spend | Revenue | ROAS | Purchases | CPA | CTR | Hook rate | Hold rate | Active creatives | Winners | New launched | Top creative | What we learned | Next test |
|---|---|---|---|---|---|---|---|---|---|---|---|---|---|---|
| 2026-W41 | 4210 | 10946 | 2.60 | 142 | 29.65 | 1.42% | 28% | 37% | 24 | 3 | 6 | UGC-GIFT-MAYAR-FIELD40-A-v01 | Gift angle beats offer statics | Three new gift hooks |
| 2026-W42 | 4480 | 12992 | 2.90 | 158 | 28.35 | 1.51% | 30% | 39% | 26 | 4 | 5 | UGC-GIFT-MAYAR-FIELD40-A-v01 | Unboxing hook holds better | Unboxing for the Diver 42 |
How to use it,
in four steps.
- 01Fill it the same day each weekMonday morning, same date range, same attribution setting. Consistency matters more than precision.
- 02Read across, not downLook at a week next to the last four. One week on its own is noise.
- 03Always fill the last two columnsWhat we learned and next test are what turn a report into a plan.
- 04Share it read-onlyClients and leadership get the sheet; the ad account stays with the team.
Two weeks for a watch brand.
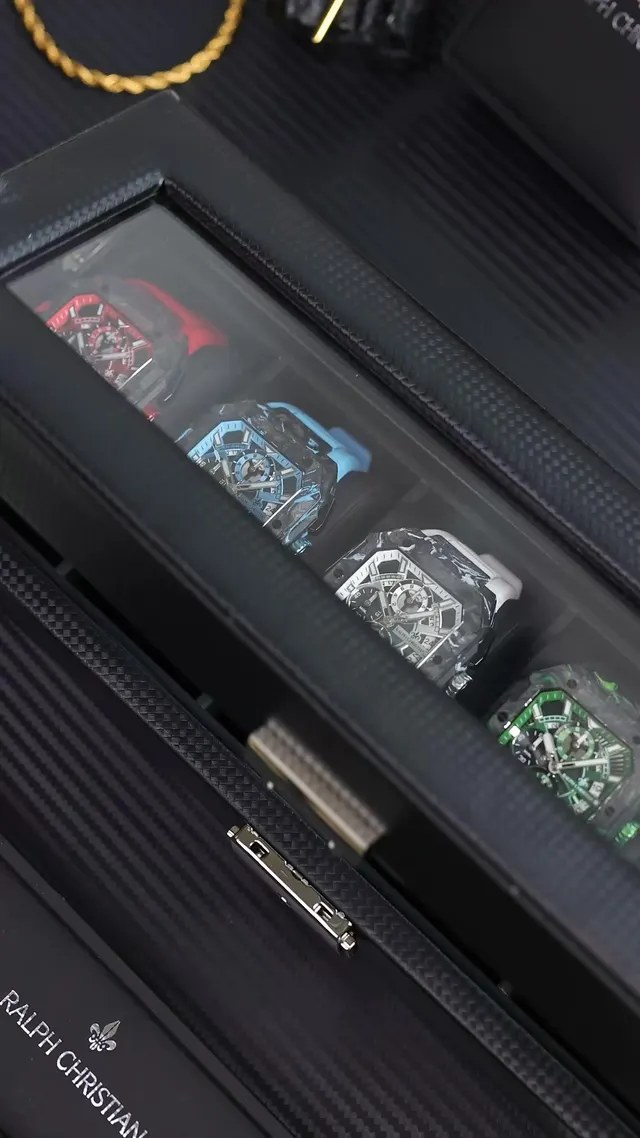
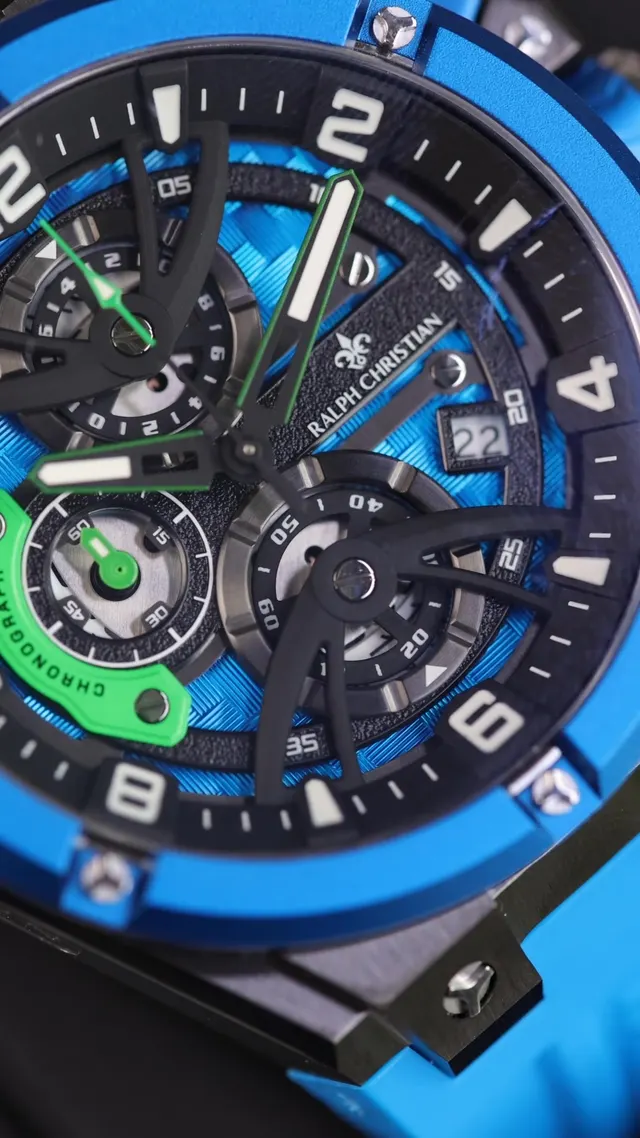
Illustrative rows for a made-up brand. They come with the download.
- W41 ROAS / CPA
- 2.60 / $29.65
- W42 ROAS / CPA
- 2.90 / $28.35
- Winners
- 3 to 4
- Next test
- Unboxing for the Diver 42
Stats
Spend
$13,740last 30d
Blended ROAS
2.31xrevenue / spend
Active winners
4ROAS ≥ 1.5x
Spend on winners
71.4%share of window spend
Creative leaderboard
Top ads this window
| Ad | Stage | |||||
|---|---|---|---|---|---|---|
 ugc-maya-field40-giftProspecting - Broad | Winner | $4,210 | 3.42x | 2.31% | 186.4K | 76 |
 motion-diver42-freeshippingProspecting - Broad | Winner | $3,180 | 2.64x | 1.88% | 152.9K | 44 |
 ugc-sam-chrono39-wristGifting - Q4 | Winner | $2,460 | 1.71x | 1.42% | 121.3K | 22 |
 studio-diver42-detailRetargeting - 30d | Testing | $1,890 | 1.18x | 0.94% | 98.7K | 12 |
 motion-straps-offerRetargeting - 30d | Underperforming | $1,240 | 0.62x | 0.51% | 88.2K | 4 |
 studio-field40-flatlayProspecting - Broad | Paused | $760 | 1.36x | 1.12% | 40.1K | 5 |
Monday's numbers,
already done.
Fovea's Stats page shows spend, blended ROAS, active winners, CTR, hook and hold for the last 7, 30 or 90 days, with a leaderboard of the creatives behind them.
Questions, answered.
What should a weekly creative report include?+
The money (spend, revenue, ROAS, CPA), attention (CTR, hook and hold rate), output (active, winning and new creatives), the top creative and the next test.
How is hook rate calculated?+
3-second video plays divided by impressions. Hold rate is ThruPlays divided by 3-second plays.
Can I share it with a client?+
Yes. Copy it into Google Sheets and share the sheet read-only. Keep revenue columns out if the client should not see them.
Copy the template.
Keep the winners.
Every brief, script and finished cut in one AI-tagged library, linked to the Meta spend and Shopify products behind it.
Start free- 14-day free trial
- No card
- No ad-spend caps